Market Trends - September 2018
San Francisco Real Estate Market Report
The Autumn Selling Season Begins
The Autumn Selling Season Begins
September 2018
In July 2018, Paragon Real Estate merged with Compass.
------------------------------------------------------------
In July 2018, Paragon Real Estate merged with Compass.
------------------------------------------------------------
September is typically the single month with the highest number of new listings coming on market in San Francisco, a big spike in inventory which fuels the relatively short autumn selling season. Very early indications are that this September may be a very big new-listing month, and how buyers react to the flood of new inventory will provide more clarity as to where the market may be heading next. That data will start becoming available in October.
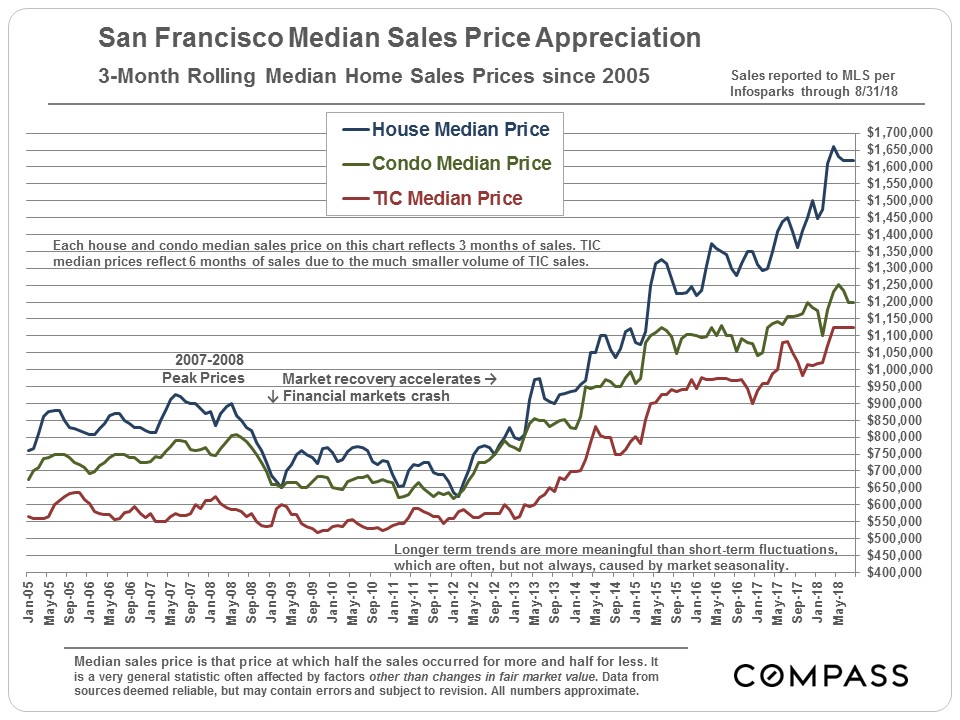
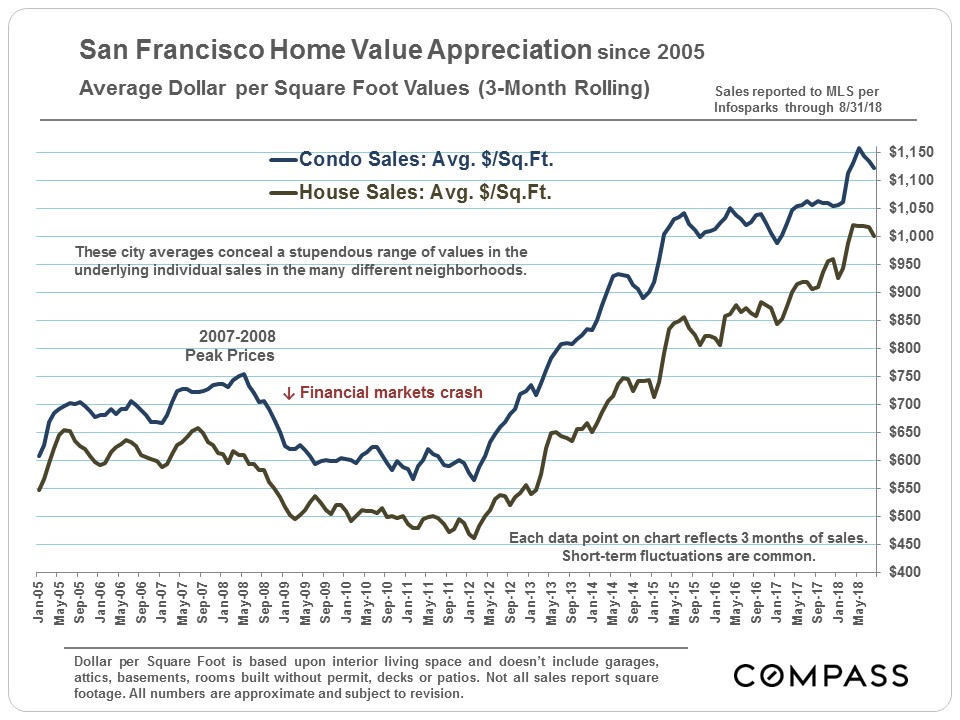
Long-Term Trends in Median Sales Prices
& Average Dollar per Square Foot Values
These first two charts look at appreciation trends in median prices and average $/sq.ft. values since 2005. The short-term fluctuations in the lines are normal, typically seasonal effects of no great meaningfulness.
As of August 2018, the 3-month rolling median sales prices are as follows: $1,620,000 for houses, $1,200,000 for condos, and $1,125,000 for TICs.
------------------------------------------------------------
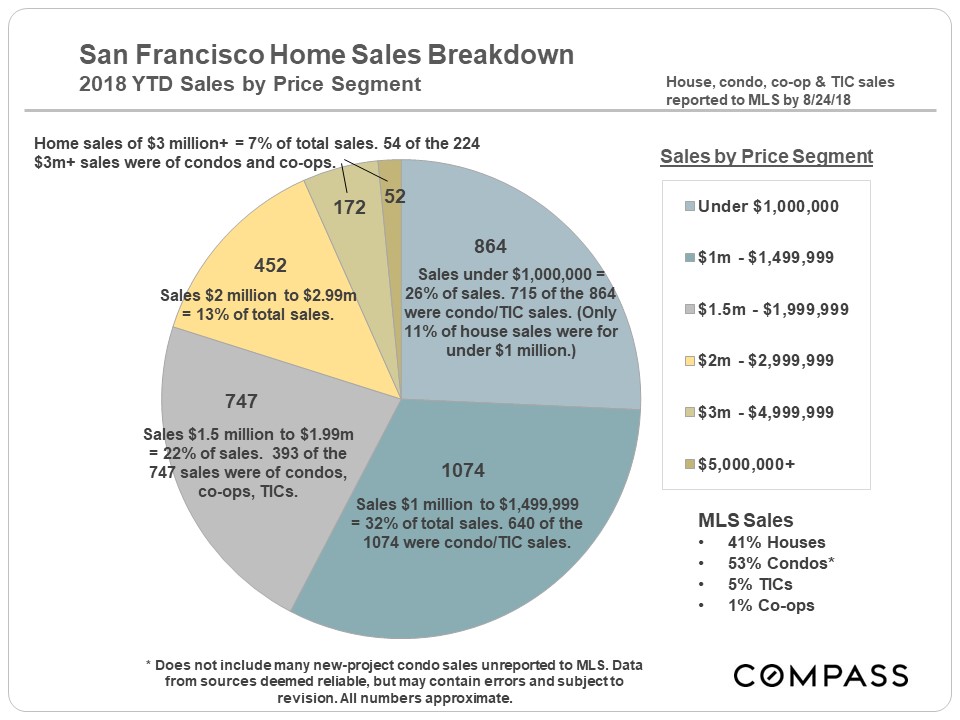
San Francisco Home Sales
by Price Segment
Houses selling for less than $1 million are becoming an endangered species in San Francisco, limited to small homes and/or fixer-uppers in the most affordable neighborhoods. Condos and TICs now dominate sales under $1.5 million.
------------------------------------------------------------
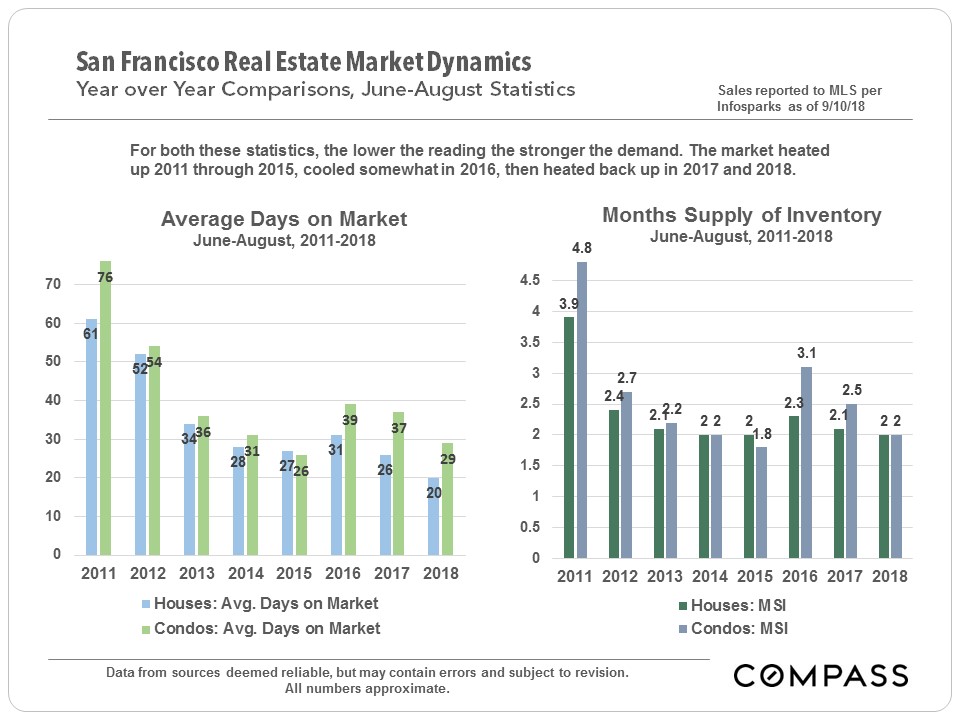
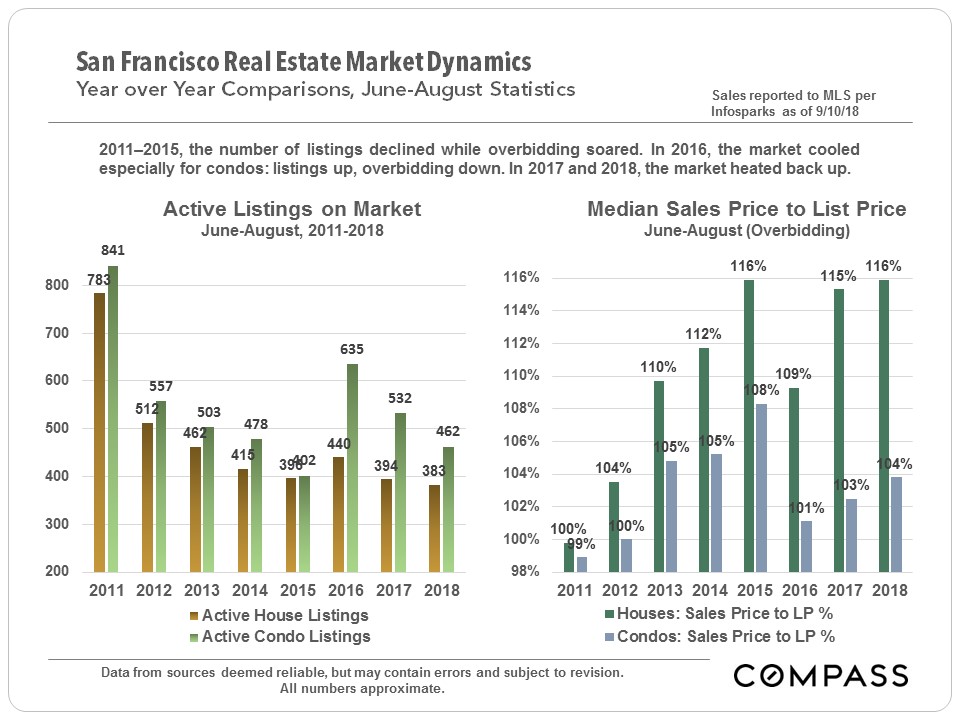
Four Standard Statistics of Supply & Demand
Year-over-Year Comparisons since 2011
These 2 charts below compare the June-August periods for the last 8 years. These statistics have been moving in parallel during this period, which make them more trustworthy as true indications of market trends.
As illustrated in the first chart, the inventory of listings available to purchase continues to be constrained, and the overbidding percentages, especially for houses, remain at insane levels (though part of this has to do with a strategy of under-pricing by many listing agents).
------------------------------------------------------------
Home Value Appreciation by City District
Since 2015
Coming out of the long, post-crash housing recession in 2012, homes all over the city began appreciating very rapidly, led at first by the most expensive neighborhoods, and this lasted through mid-late 2015. Then, in the last 4 months of 2015, financial markets went into a period of extended volatility and unease (Chinese stock market and oil price crashes, Brexit and election anxieties), which ran through the 2016 election. At the same time hiring in high-tech temporarily slowed and high-tech IPO activity ground to a halt. New condo construction in the city also soared, changing the supply and demand dynamic for that property type. These factors had significant effects on the luxury home and condo segments.
Since 2015, appreciation of houses has far outpaced that of condos, and homes in more affordable areas have appreciated much faster than in more expensive neighborhoods. The lower the home prices, the higher the appreciation rates. However, virtually all segments saw a dramatic surge of demand in late 2017 through spring 2018, propelling values quickly higher.
------------------------------------------------------------
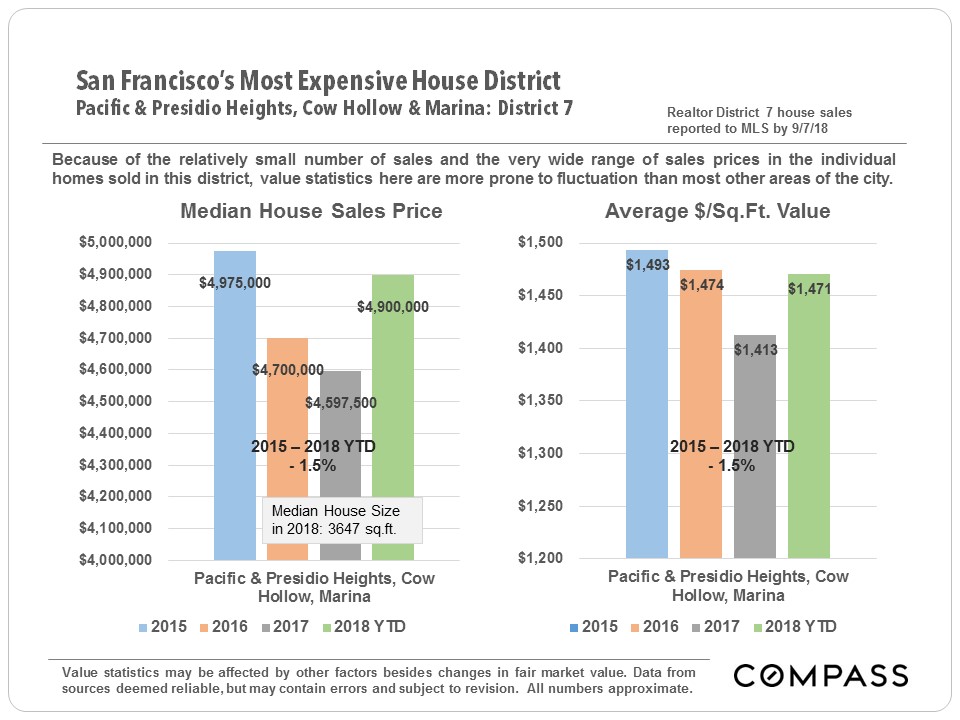
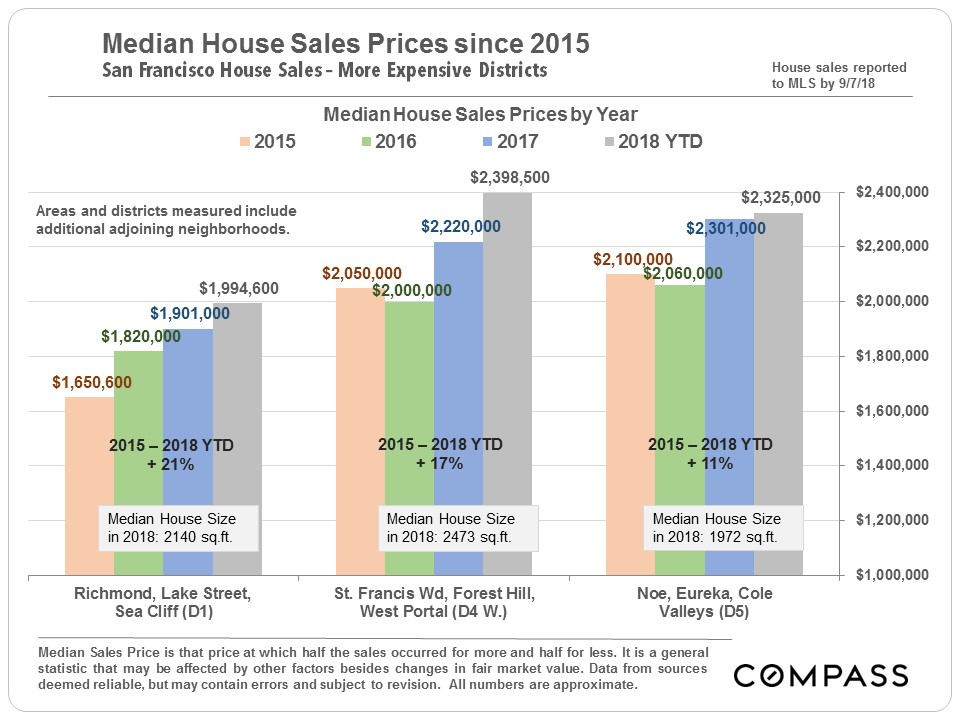
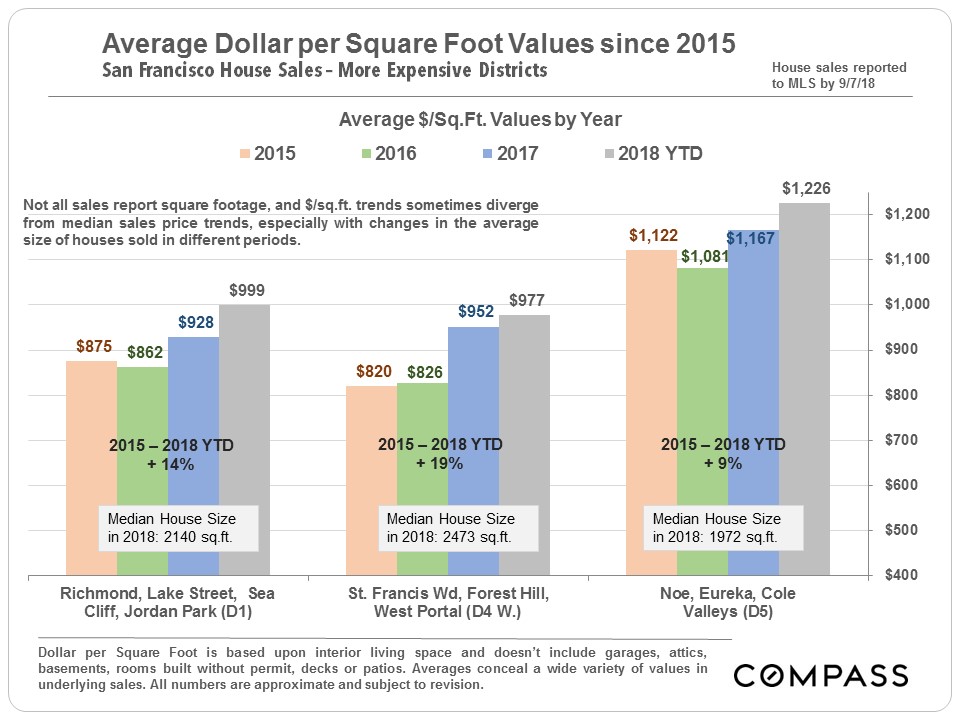
House Values: More Expensive Districts
Though the median house sales price in the very expensive Pacific Heights-Marina district has not increased in the past 3 years - in fact, it has seen a small overall decline - it is worth noting that from the beginning of 2012 to the end of 2015, it appreciated by a whopping 87%.
Partial year data should be considered preliminary until full year results are available in January.
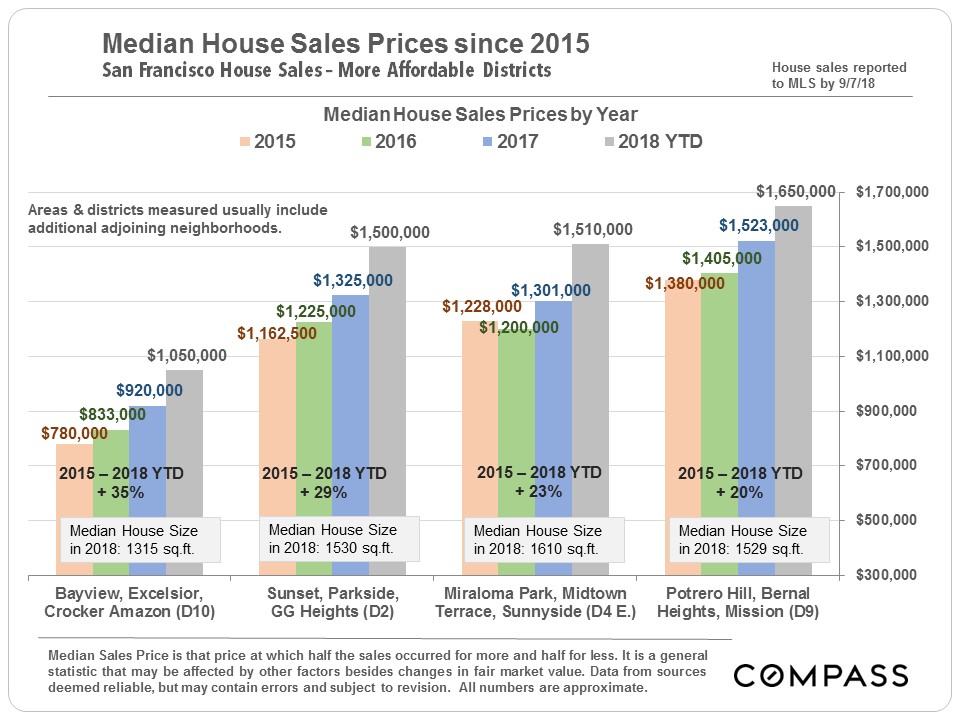
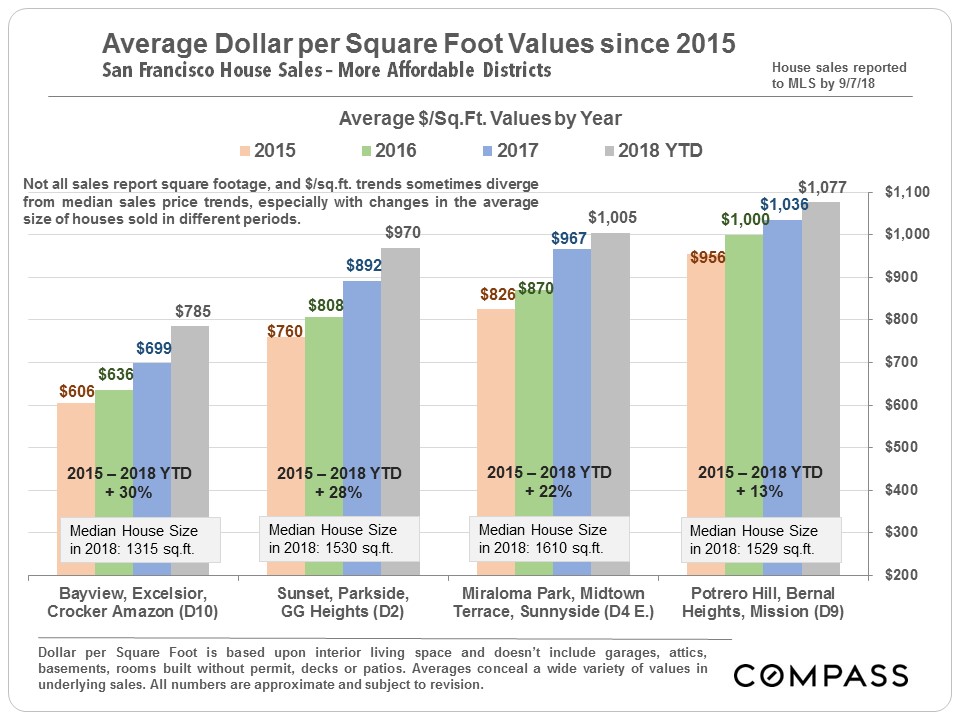
House Values: More Affordable Districts
In these neighborhoods, large bursts of appreciation have been common in recent years, as the pressure of buyer demand shifted to a search for affordability.
------------------------------------------------------------
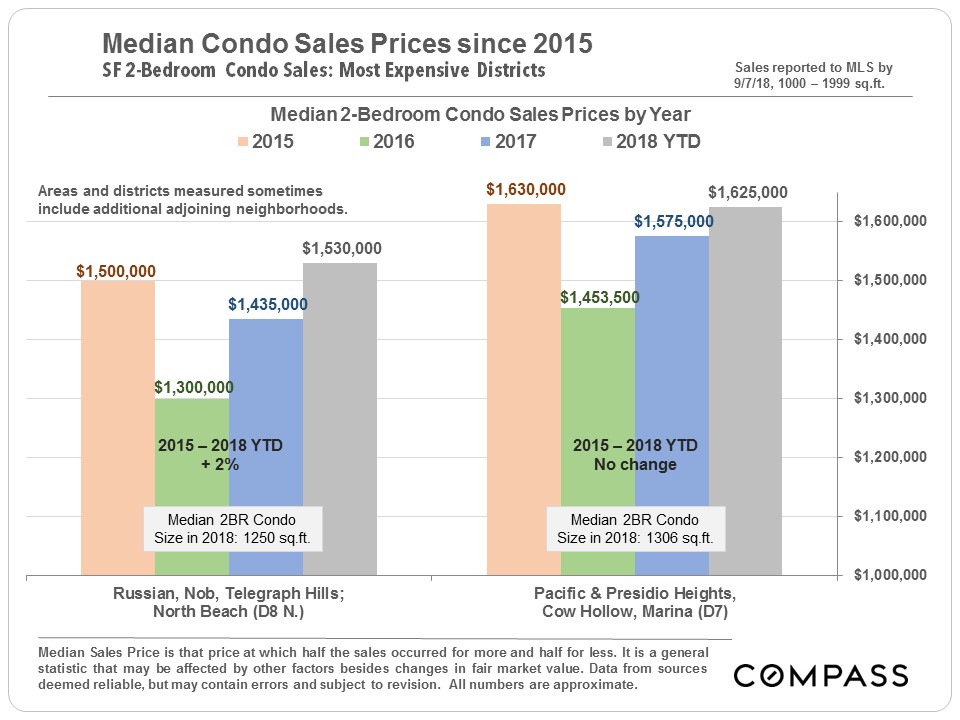
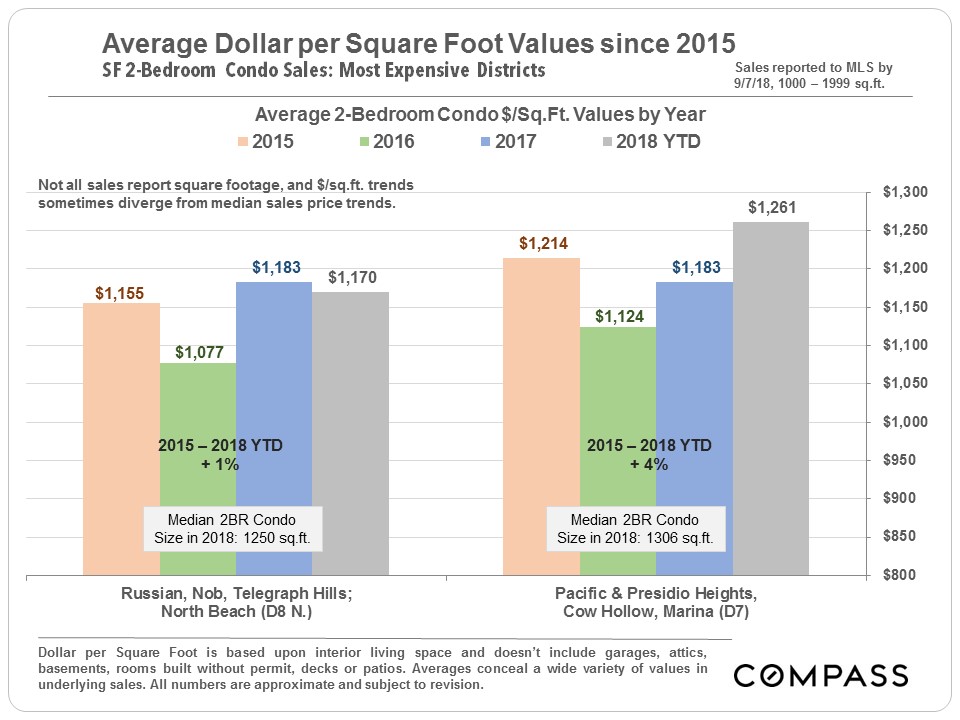
Condo Values: More Expensive Districts
As with houses, the most expensive neighborhoods for condos have seen limited or no appreciation in median sales prices since 2015.
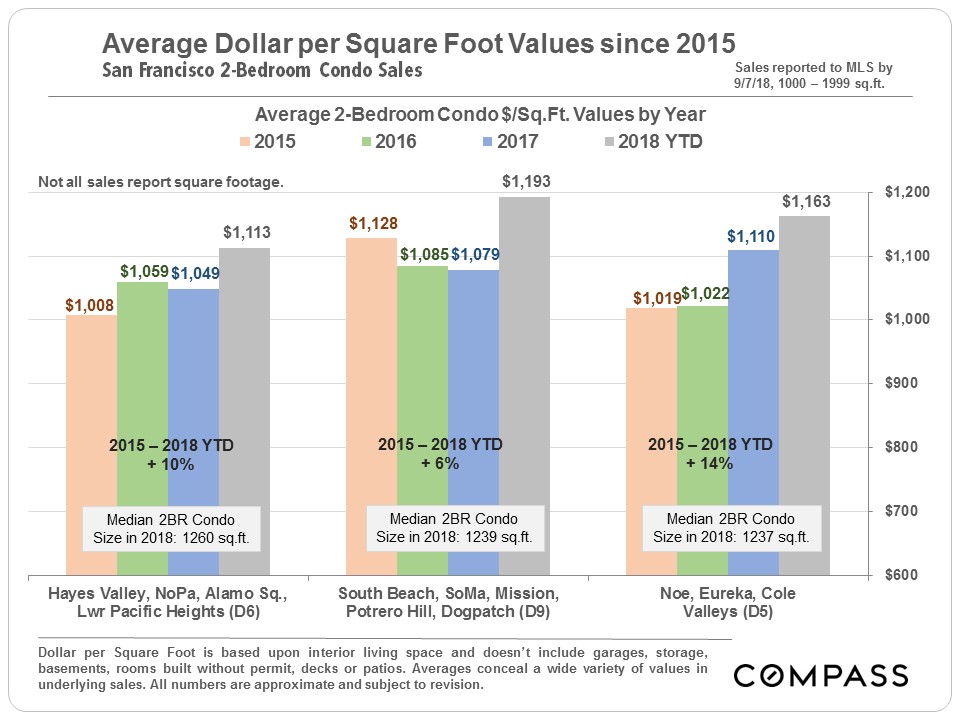
Values in Other Major Condo Districts
The large South Beach-SoMa-Mission-Potrero Hill-Dogpatch district has been ground zero for the greatest number of large new-condo projects coming on market. That led to a drop in median sales price in 2016, but in 2018, prices jumped dramatically in all 3 districts illustrated below.

------------------------------------------------------------
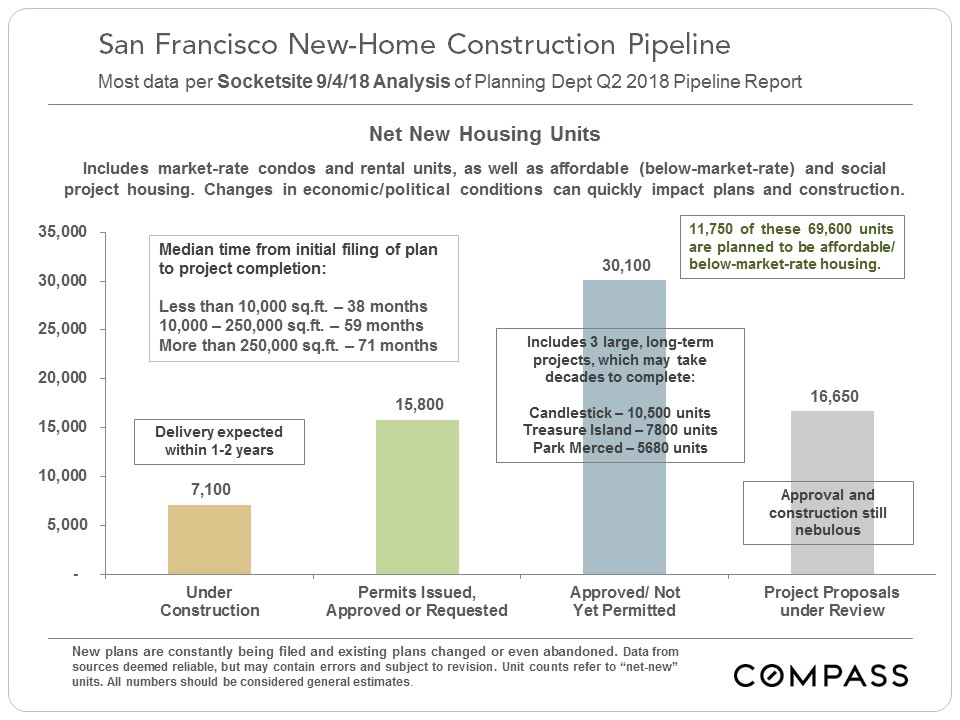
San Francisco New Housing Pipeline
The number of units somewhere along the line in the San Francisco Planning Department new housing pipeline hit almost 70,000 in Q2 2018, however developers face increasing challenges in land and constructions costs, reportedly the second highest in the nation, as well as issues pertaining to affordable housing requirements, neighborhood activism, possible increases in rent control measures, and the lengthy review and approvals process. The outlook in new housing construction can shift very quickly if economic conditions change.
Projects of 20-Plus Units under Construction
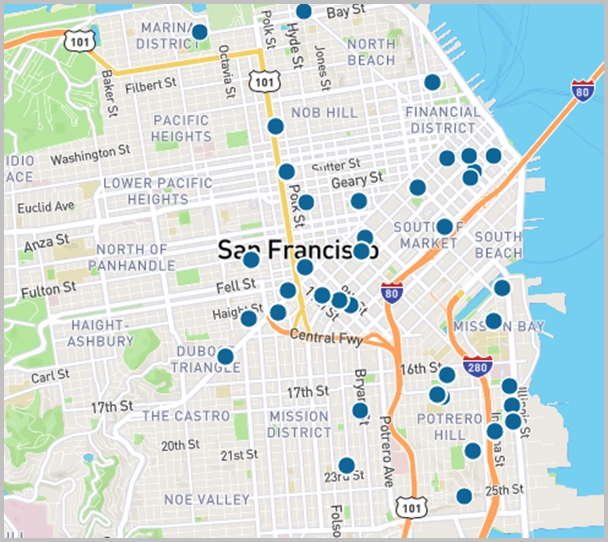
The main areas for new home construction - of both condos and apartments - are the greater South Beach-SoMa-Potrero Hill district, and the Market Street and Van Ness Avenue corridors. These are the areas where large, previously commercial-use lots can be used for building large projects, and where zoning often allows for much taller buildings.
------------------------------------------------------------
& Average Dollar per Square Foot Values
These first two charts look at appreciation trends in median prices and average $/sq.ft. values since 2005. The short-term fluctuations in the lines are normal, typically seasonal effects of no great meaningfulness.
As of August 2018, the 3-month rolling median sales prices are as follows: $1,620,000 for houses, $1,200,000 for condos, and $1,125,000 for TICs.
------------------------------------------------------------
San Francisco Home Sales
by Price Segment
Houses selling for less than $1 million are becoming an endangered species in San Francisco, limited to small homes and/or fixer-uppers in the most affordable neighborhoods. Condos and TICs now dominate sales under $1.5 million.
------------------------------------------------------------
Four Standard Statistics of Supply & Demand
Year-over-Year Comparisons since 2011
These 2 charts below compare the June-August periods for the last 8 years. These statistics have been moving in parallel during this period, which make them more trustworthy as true indications of market trends.
As illustrated in the first chart, the inventory of listings available to purchase continues to be constrained, and the overbidding percentages, especially for houses, remain at insane levels (though part of this has to do with a strategy of under-pricing by many listing agents).
------------------------------------------------------------
Home Value Appreciation by City District
Since 2015
Coming out of the long, post-crash housing recession in 2012, homes all over the city began appreciating very rapidly, led at first by the most expensive neighborhoods, and this lasted through mid-late 2015. Then, in the last 4 months of 2015, financial markets went into a period of extended volatility and unease (Chinese stock market and oil price crashes, Brexit and election anxieties), which ran through the 2016 election. At the same time hiring in high-tech temporarily slowed and high-tech IPO activity ground to a halt. New condo construction in the city also soared, changing the supply and demand dynamic for that property type. These factors had significant effects on the luxury home and condo segments.
Since 2015, appreciation of houses has far outpaced that of condos, and homes in more affordable areas have appreciated much faster than in more expensive neighborhoods. The lower the home prices, the higher the appreciation rates. However, virtually all segments saw a dramatic surge of demand in late 2017 through spring 2018, propelling values quickly higher.
------------------------------------------------------------
House Values: More Expensive Districts
Though the median house sales price in the very expensive Pacific Heights-Marina district has not increased in the past 3 years - in fact, it has seen a small overall decline - it is worth noting that from the beginning of 2012 to the end of 2015, it appreciated by a whopping 87%.
Partial year data should be considered preliminary until full year results are available in January.
House Values: More Affordable Districts
In these neighborhoods, large bursts of appreciation have been common in recent years, as the pressure of buyer demand shifted to a search for affordability.
------------------------------------------------------------
Condo Values: More Expensive Districts
As with houses, the most expensive neighborhoods for condos have seen limited or no appreciation in median sales prices since 2015.
Values in Other Major Condo Districts
The large South Beach-SoMa-Mission-Potrero Hill-Dogpatch district has been ground zero for the greatest number of large new-condo projects coming on market. That led to a drop in median sales price in 2016, but in 2018, prices jumped dramatically in all 3 districts illustrated below.
------------------------------------------------------------
San Francisco New Housing Pipeline
The number of units somewhere along the line in the San Francisco Planning Department new housing pipeline hit almost 70,000 in Q2 2018, however developers face increasing challenges in land and constructions costs, reportedly the second highest in the nation, as well as issues pertaining to affordable housing requirements, neighborhood activism, possible increases in rent control measures, and the lengthy review and approvals process. The outlook in new housing construction can shift very quickly if economic conditions change.
Projects of 20-Plus Units under Construction
The main areas for new home construction - of both condos and apartments - are the greater South Beach-SoMa-Potrero Hill district, and the Market Street and Van Ness Avenue corridors. These are the areas where large, previously commercial-use lots can be used for building large projects, and where zoning often allows for much taller buildings.
------------------------------------------------------------
It is impossible to know how median and average value statistics apply to any particular home without a specific, tailored, comparative market analysis.
These analyses were made in good faith with data from sources deemed reliable, but may contain errors and are subject to revision. It is not our intent to convince you of a particular position, but to attempt to provide straightforward data and analysis, so you can make your own informed decisions. Median and average statistics are enormous generalities: There are hundreds of different markets in San Francisco and the Bay Area, each with its own unique dynamics. Median prices and average dollar per square foot values can be and often are affected by other factors besides changes in fair market value. Longer term trends are much more meaningful than short-term.
These analyses were made in good faith with data from sources deemed reliable, but may contain errors and are subject to revision. It is not our intent to convince you of a particular position, but to attempt to provide straightforward data and analysis, so you can make your own informed decisions. Median and average statistics are enormous generalities: There are hundreds of different markets in San Francisco and the Bay Area, each with its own unique dynamics. Median prices and average dollar per square foot values can be and often are affected by other factors besides changes in fair market value. Longer term trends are much more meaningful than short-term.